
Click on each image to download the interactive chart (viewable in your browser).
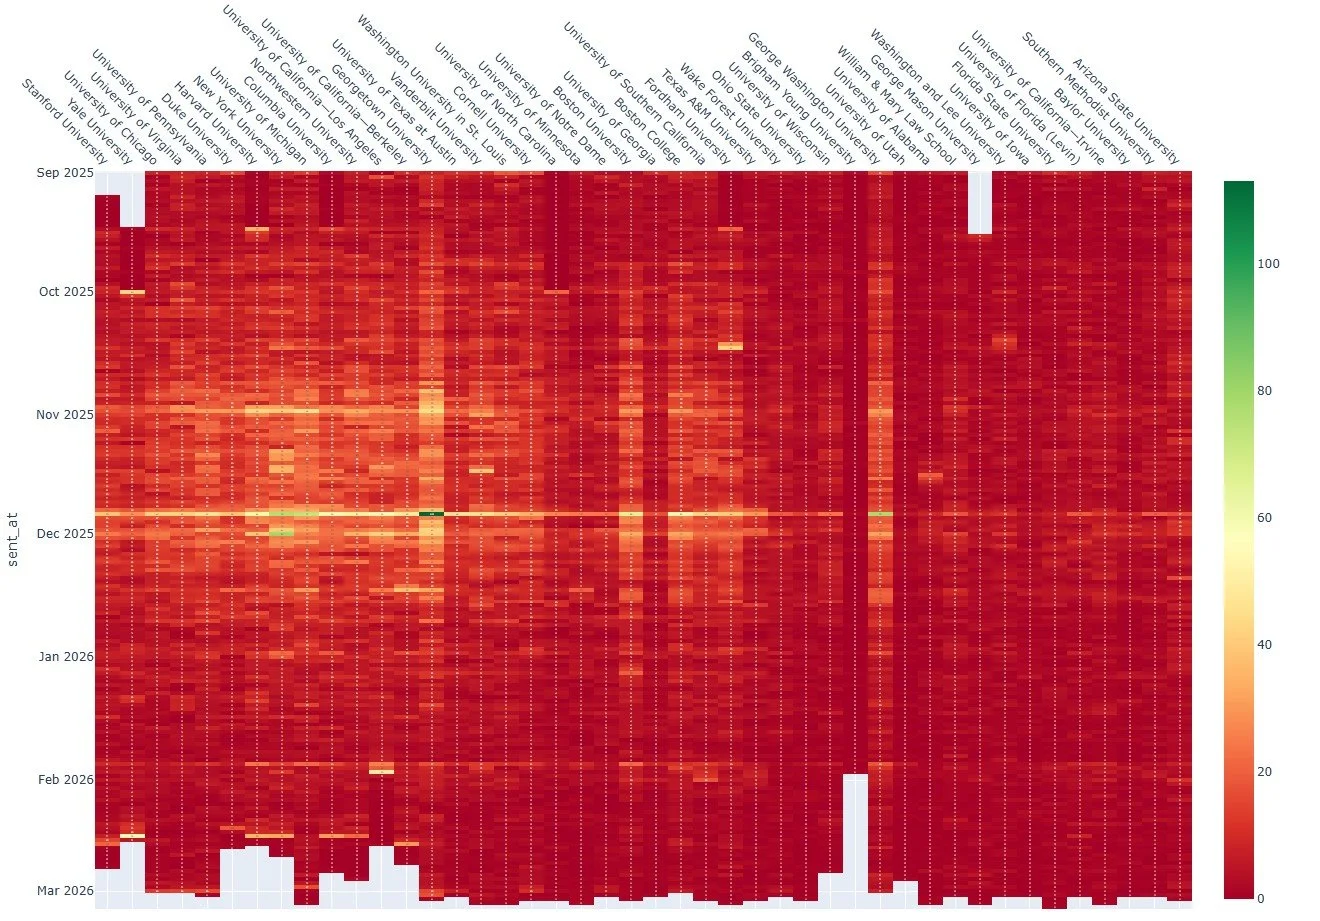
When Applications were Sent in Across Law Schools in the 2025-2026 Cycle (by March 5th)
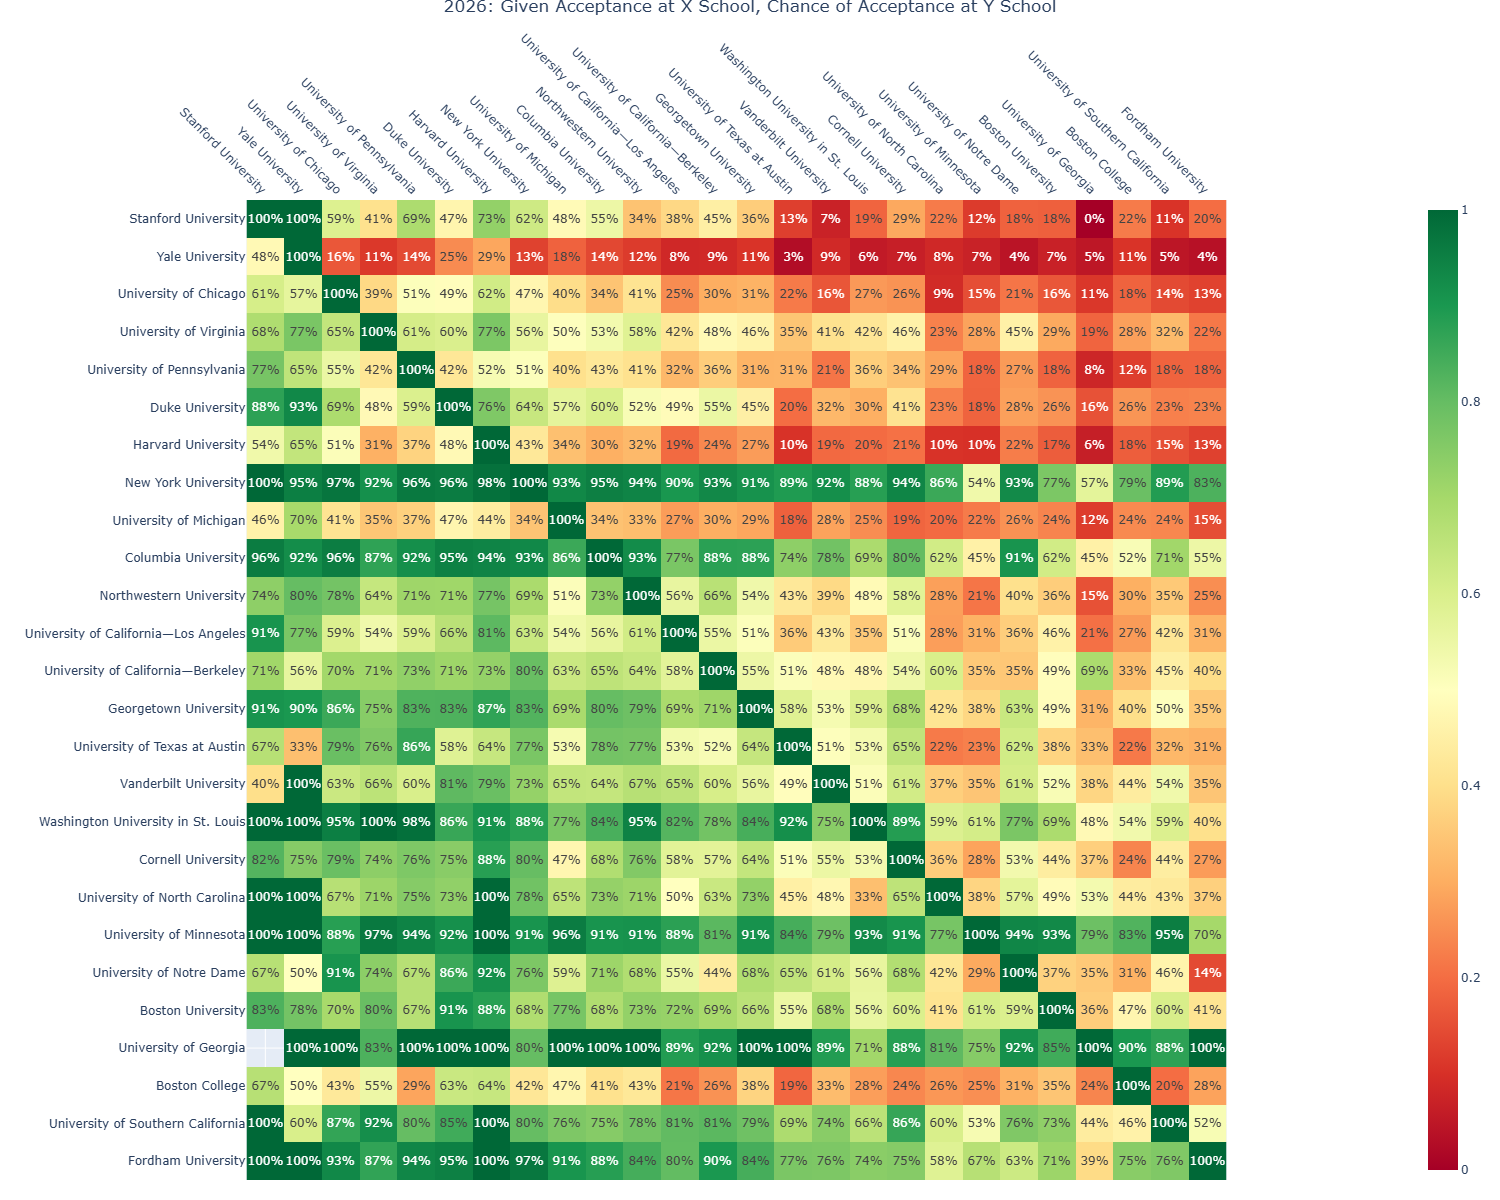
Given an Acceptance to School X (Listed on the Top), What Percent of Applicants (Who have Heard Back) have been Accepted at School Y (by March 16th in the 2025-2026 Cycle)
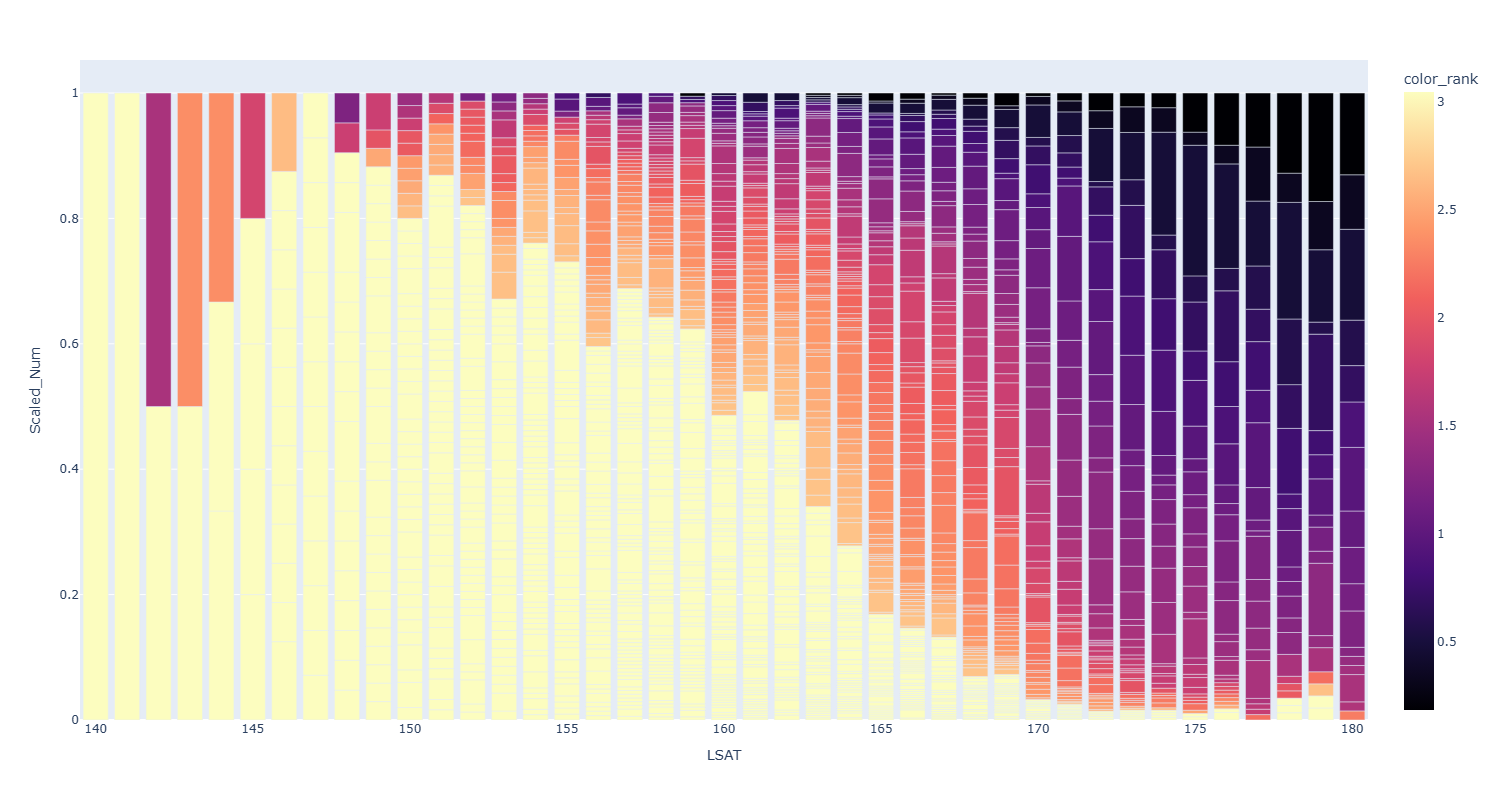
Outcomes (School Attended) Distribution over LSAT Scores, Scaled
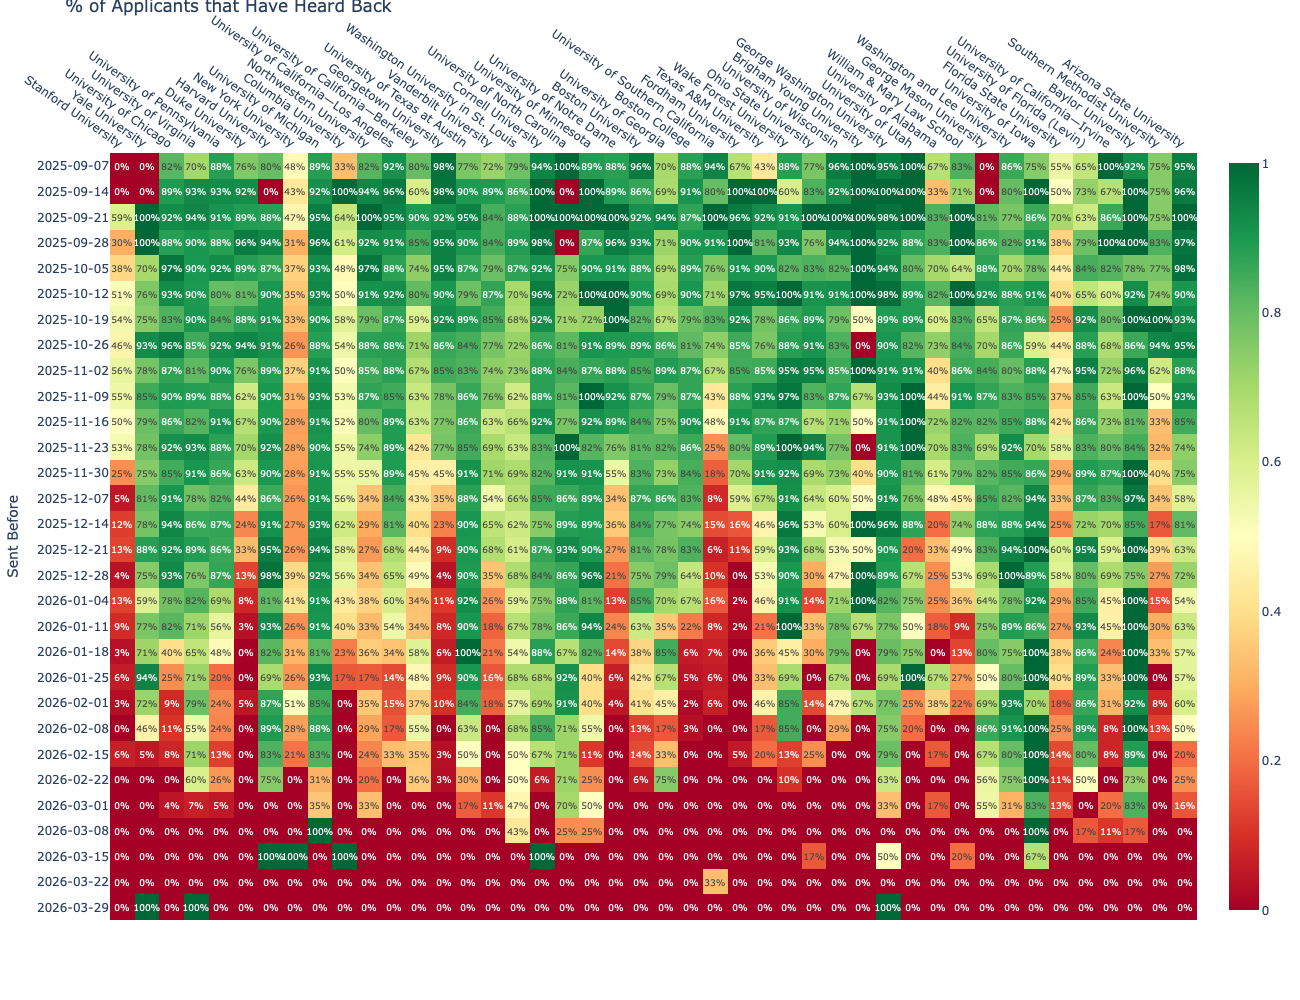
Percent of Applicants (by Submission Date) that have Heard Back (by the Morning of March 26th)
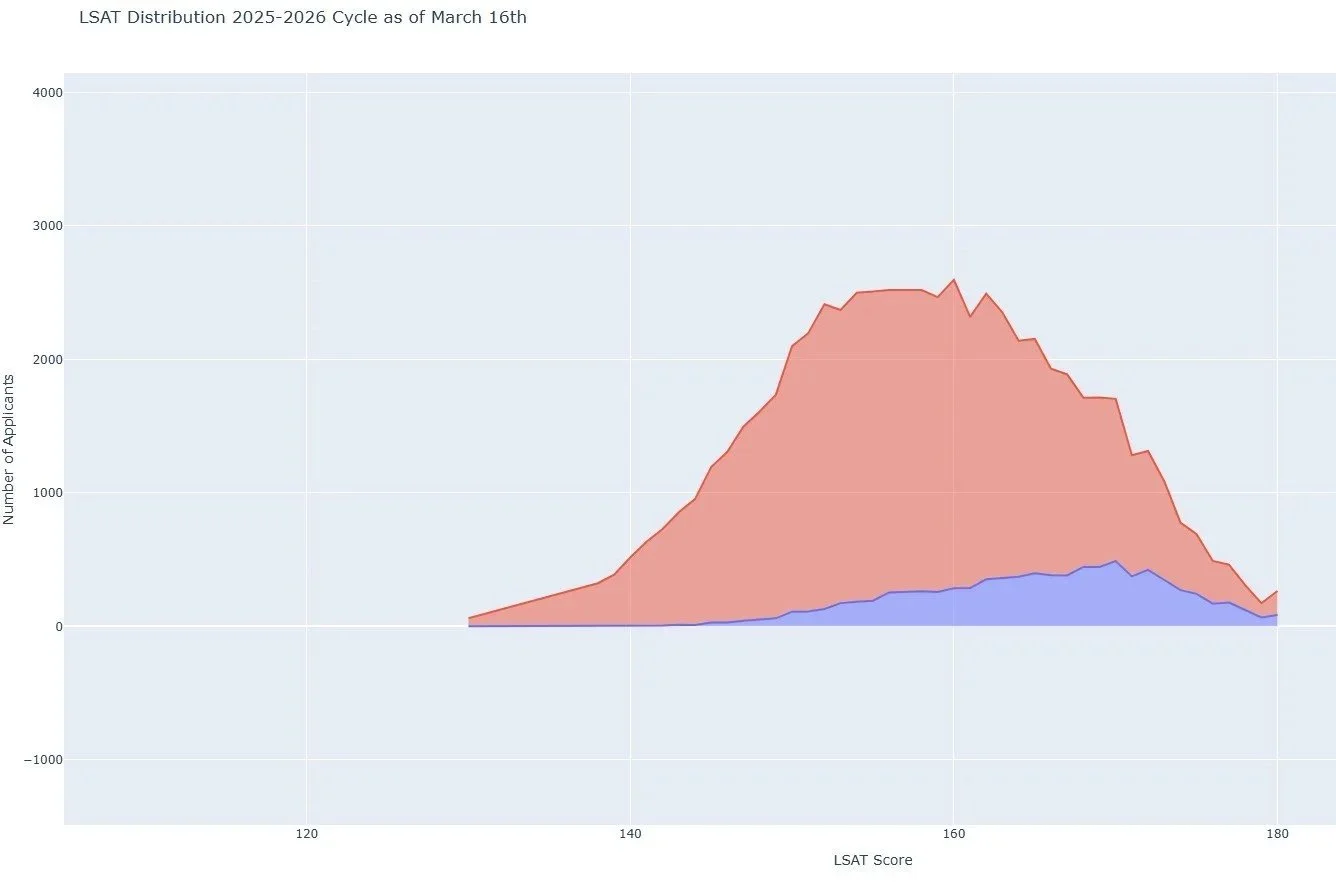
LSAT Score Distribution on the Law School Data Website (by March 5th) Versus Law School Admission Council Data Reports (by March 16th) in the 2025-2026 Cycle
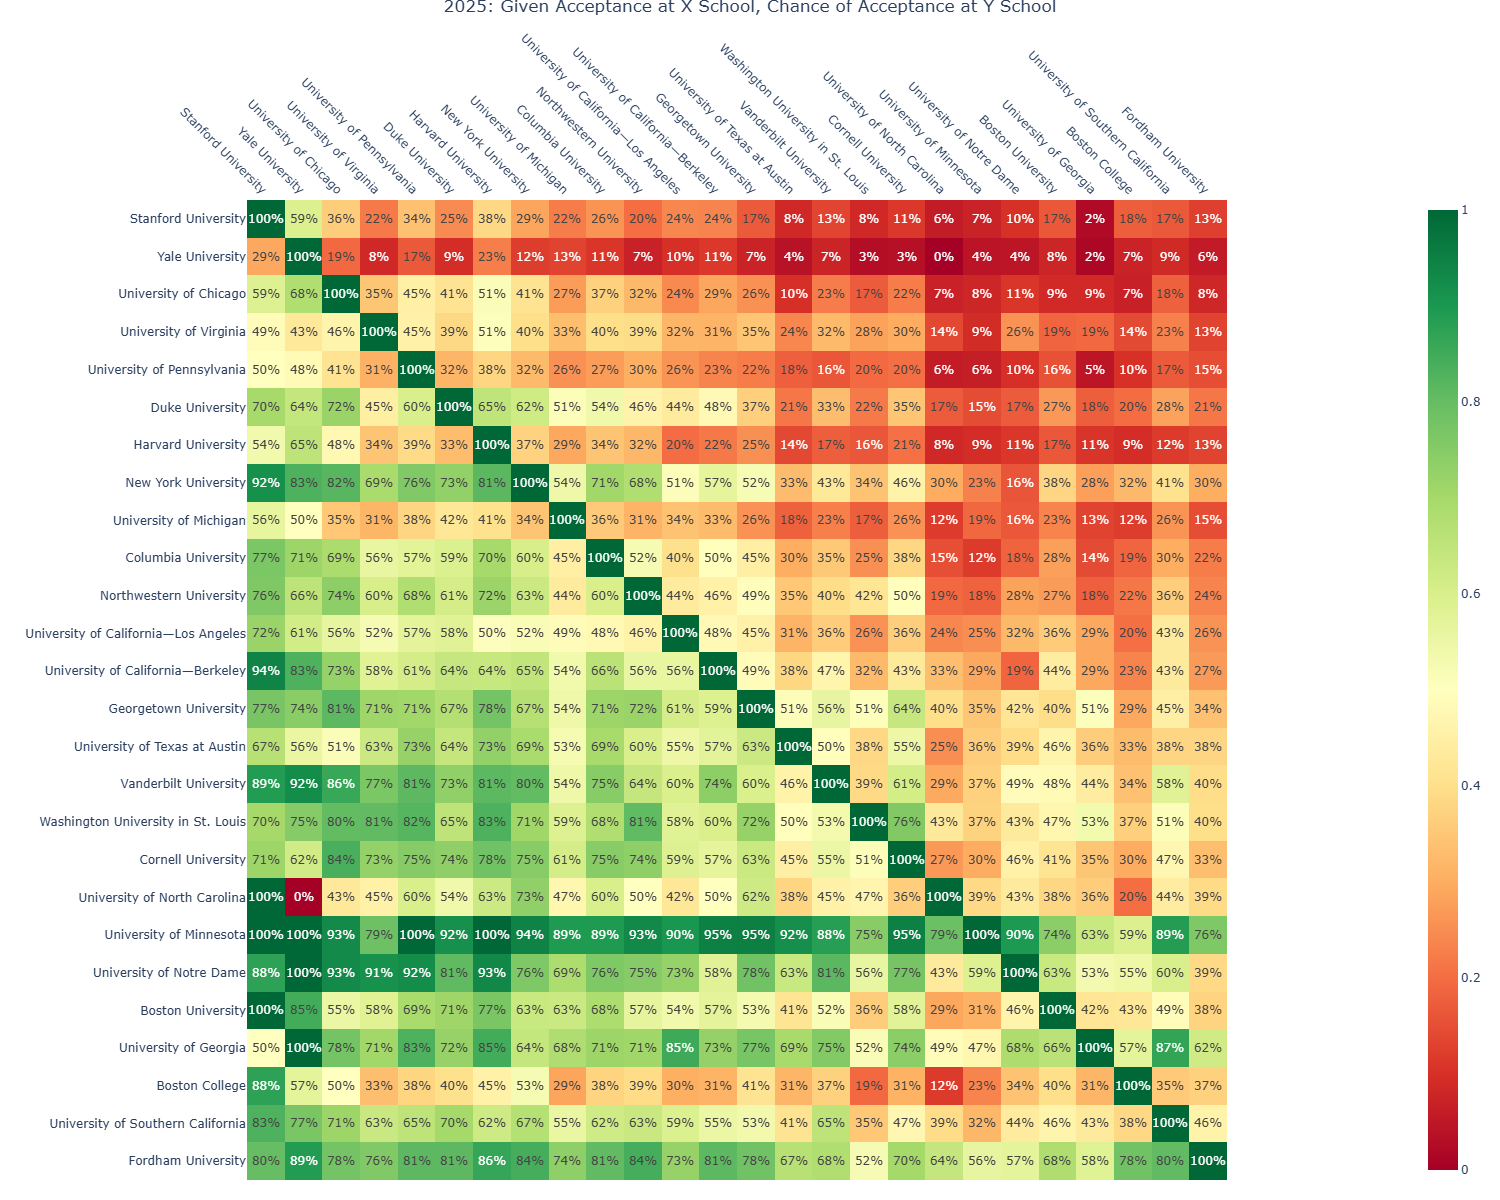
Given an Acceptance to School X (Listed on the Top), What Percent of Applicants (Who have Heard Back) have been Accepted at School Y in the 2024-2025 Cycle
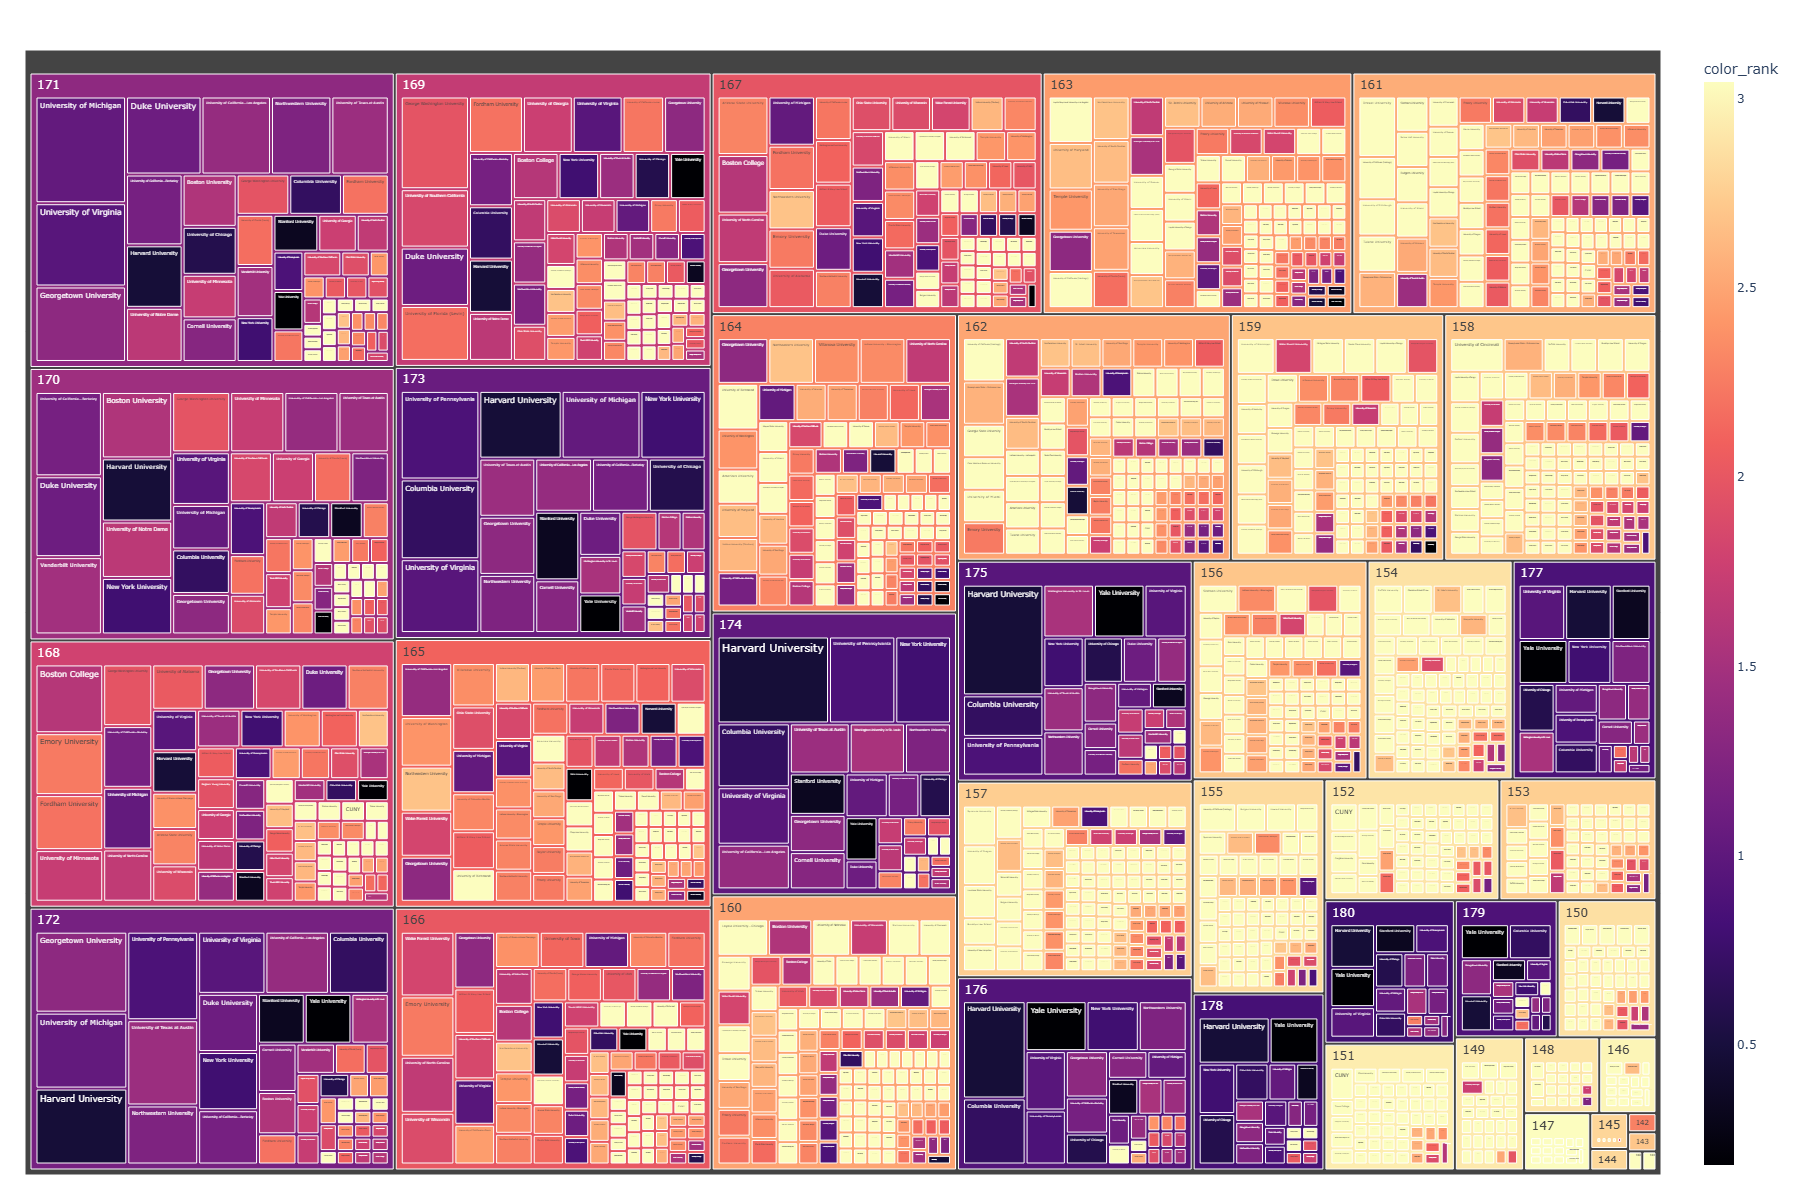
Tree Map Visualization of School Attended by LSAT Score
Visualizations made with the Plotly Python library.
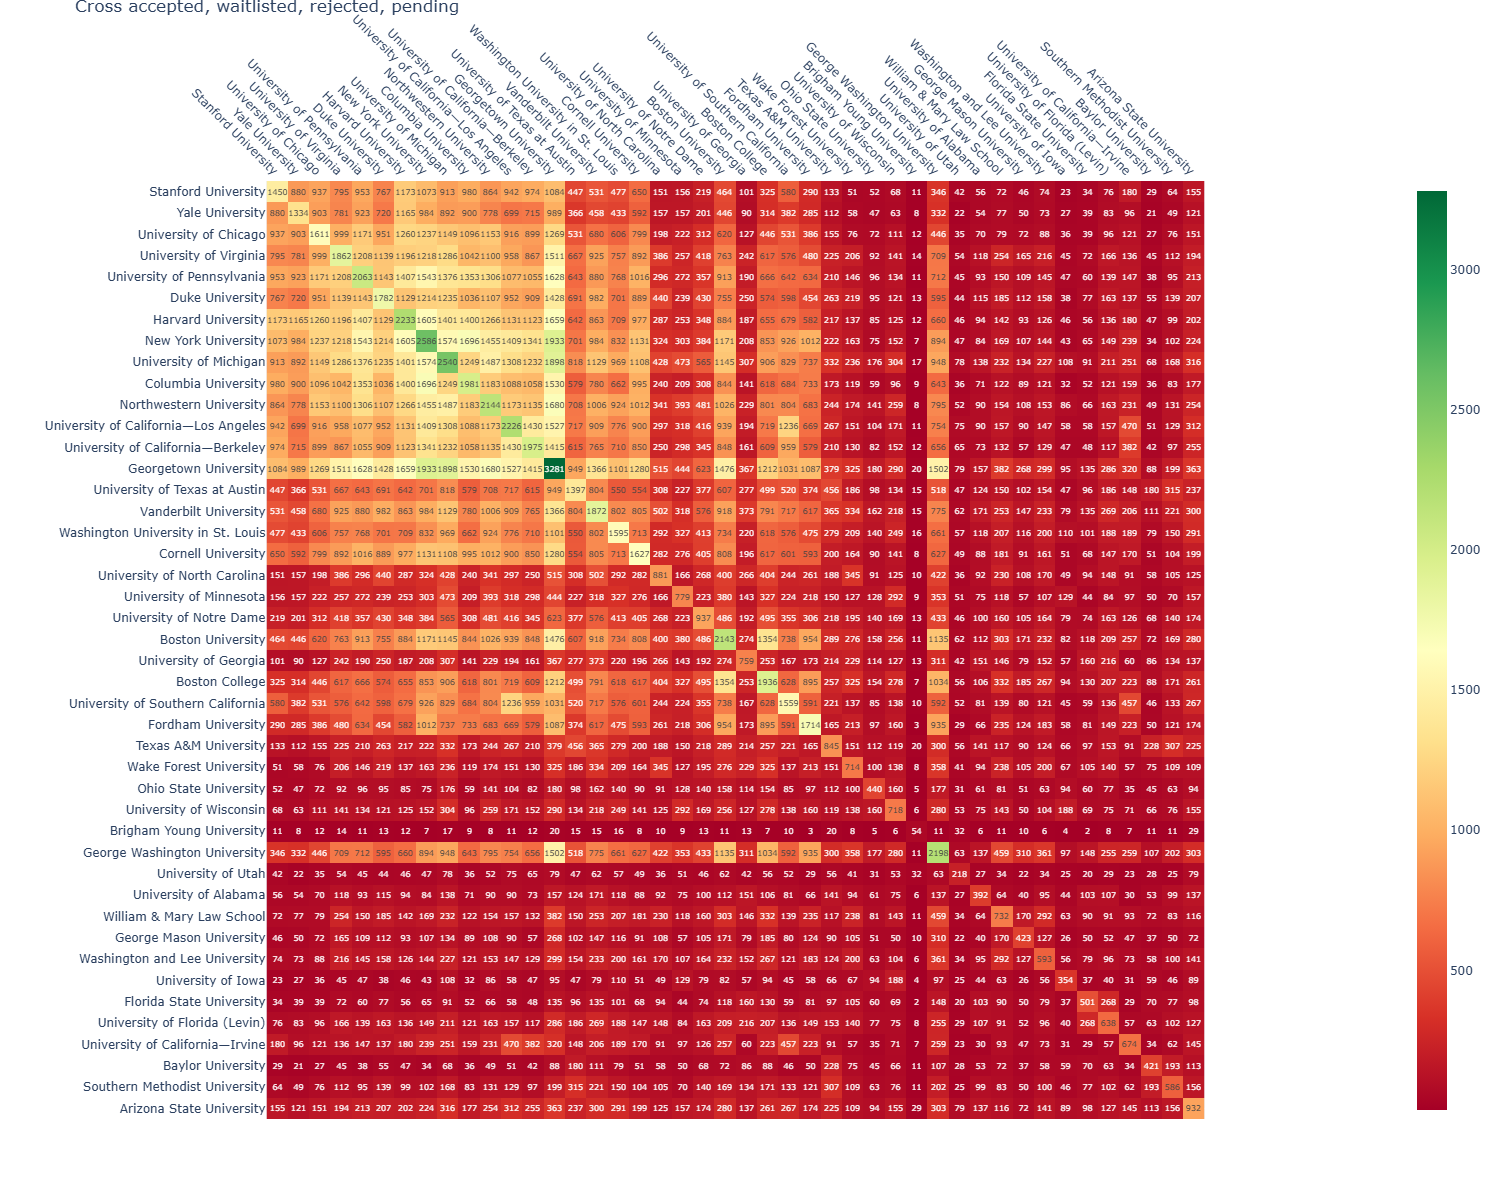
Cross Application Counts for 40 Law Schools by March 5th in the 2025-2026 Cycle
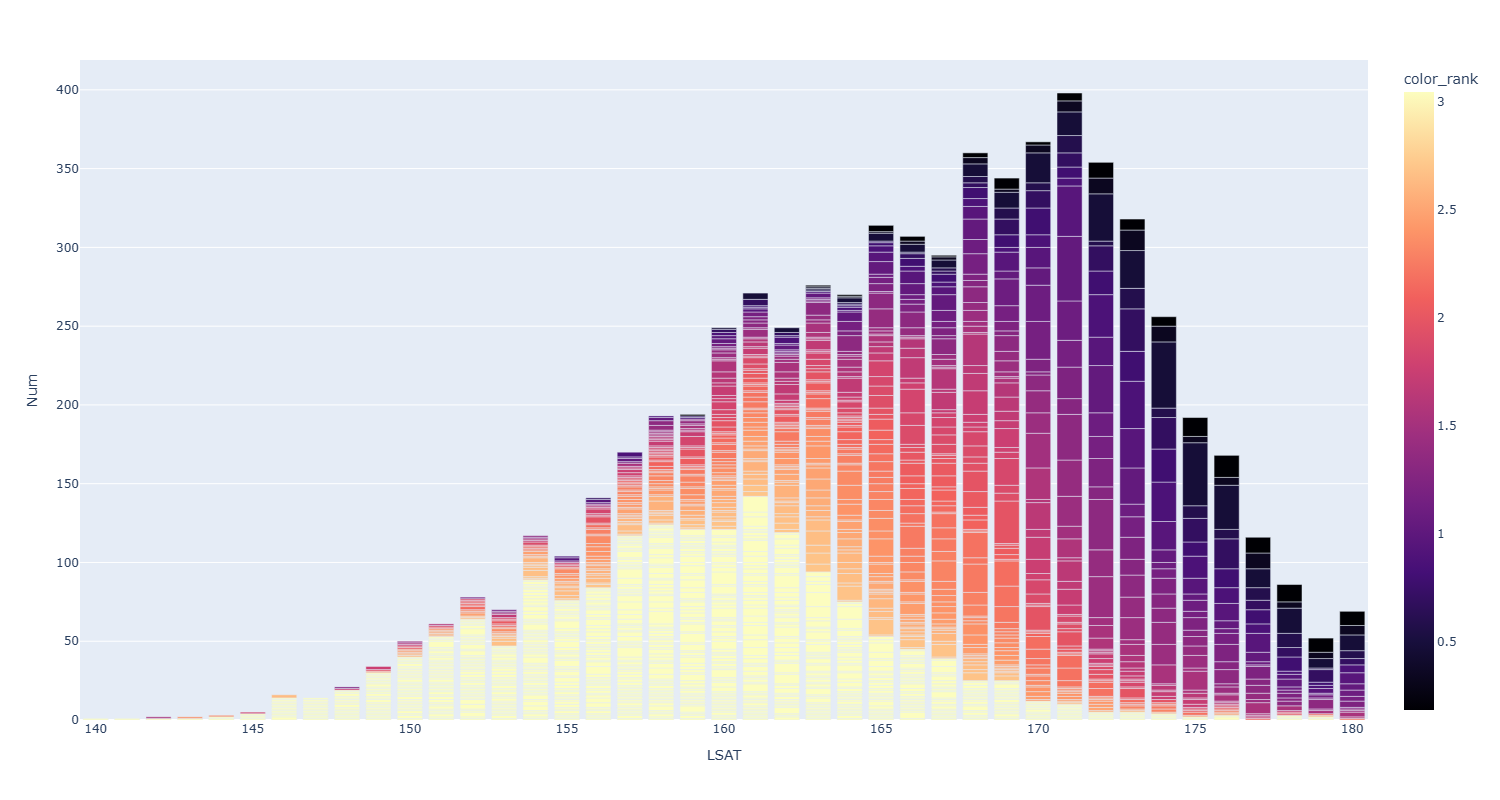
Outcomes (School Attended) Distribution over LSAT Scores
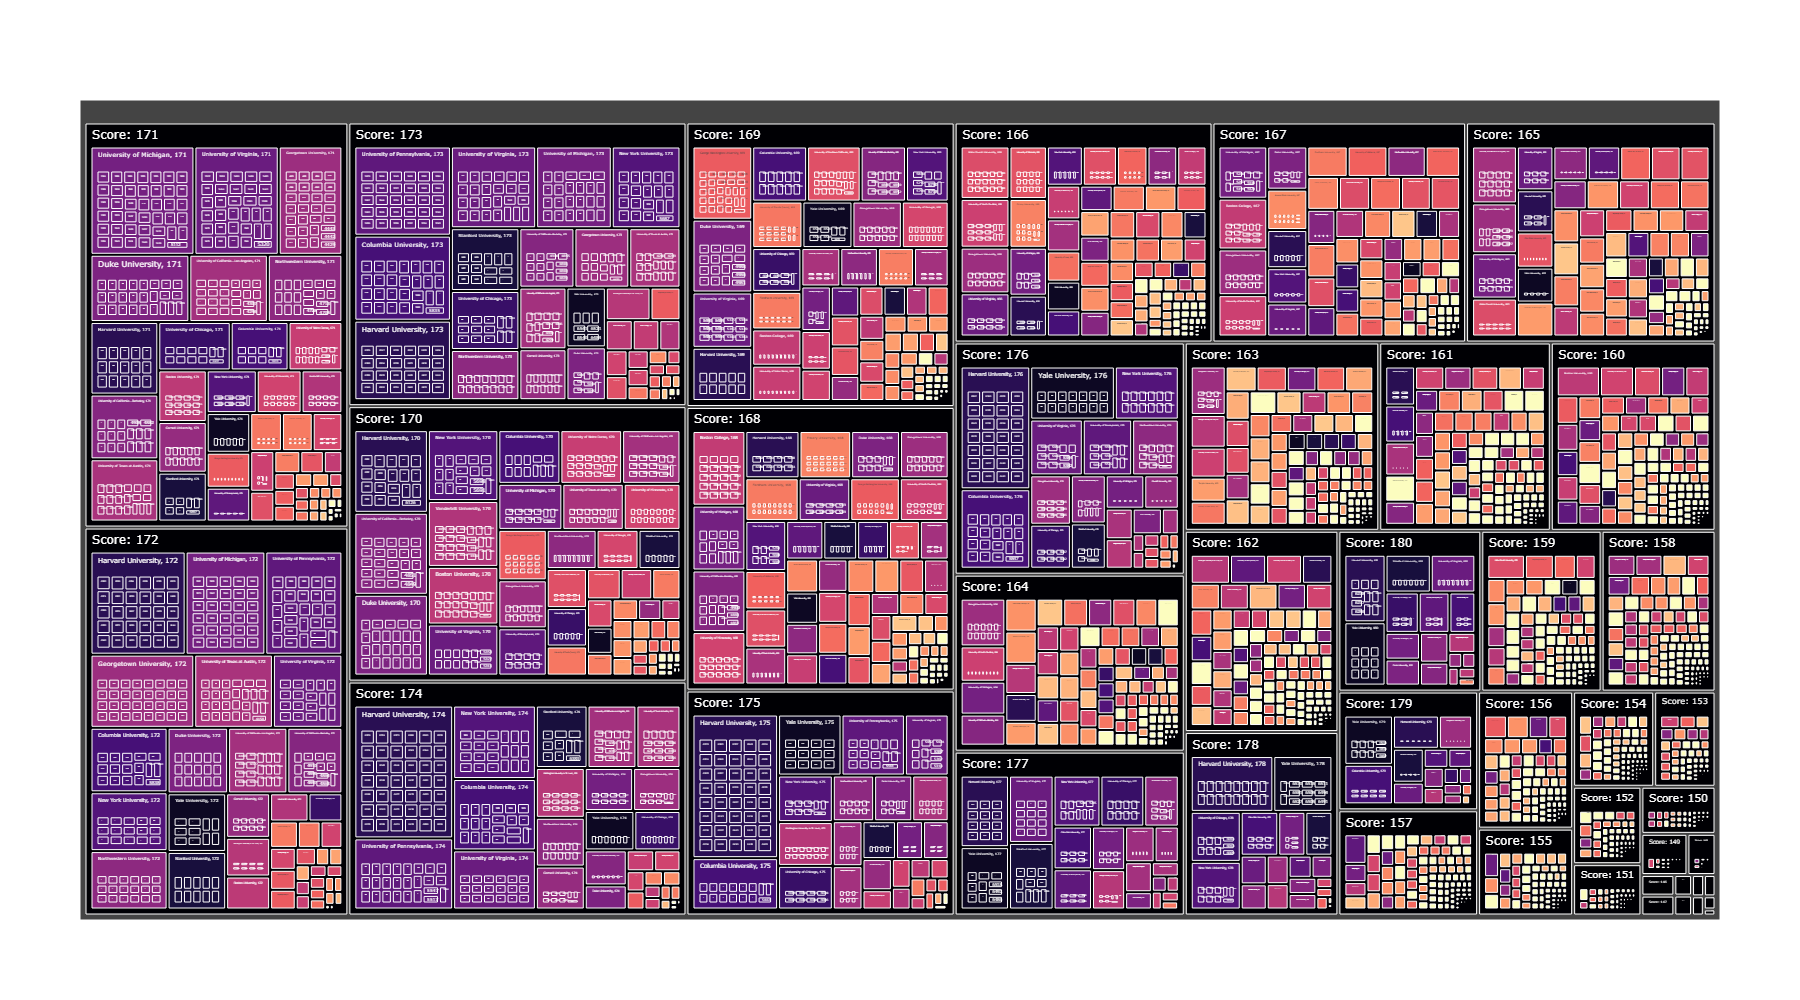
Tree Map Visualization of School Attended by Applicant, Grouped by LSAT Score